Recently I’ve refurbished an old project of mine, the Call Center Simulator CCsim (https://apps.apple.com/de/app/ccsim/id1519438028?mt=12). It was a lot of fun to develop this heavy multithreading app. One main reason for me at the very beginning was to see how big the influence of the actual shape of distributions (e.g. for the call duration) besides the mean value is on the results. Now we do have this tool and we can play around a little bit.
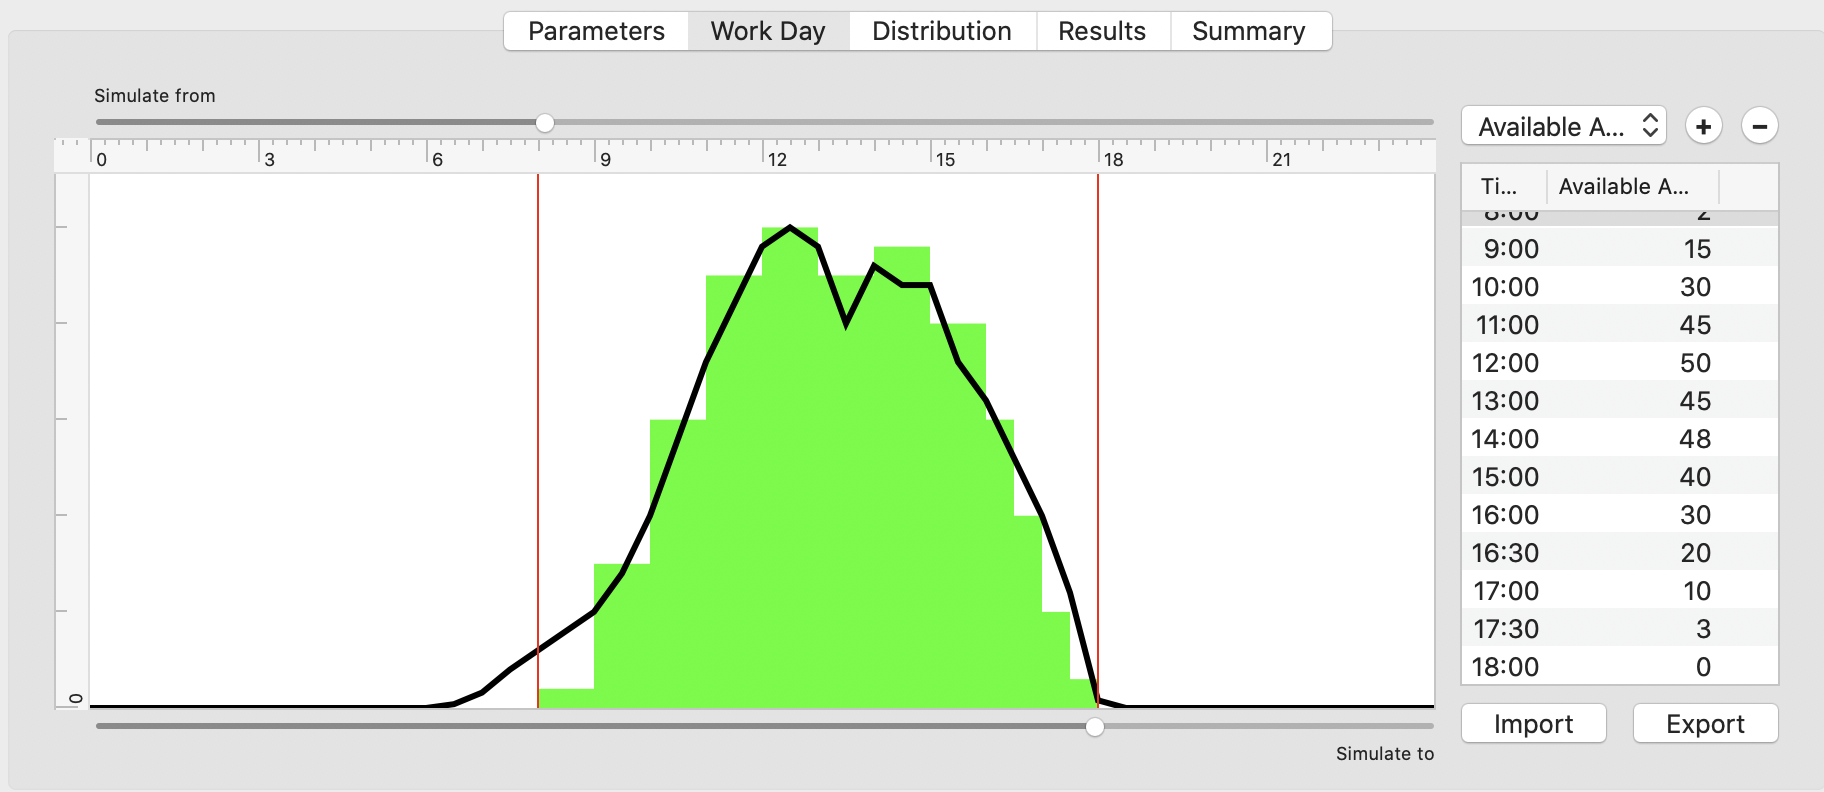
Let’s pick the default scenario with a quite bad reachability of our small call center. It has in peak times 50 agents onboard and 1250 Busy Hour Call Attempts (BHCA).
To test the influence of distributions we take the call duration, the most important parameter for the reachability if agents and call attempts are fixed. The default distribution type for call durations in CCsim is the Maxwell-Boltzmann distribution. It is slightly asymmetric with a long tail to higher values.
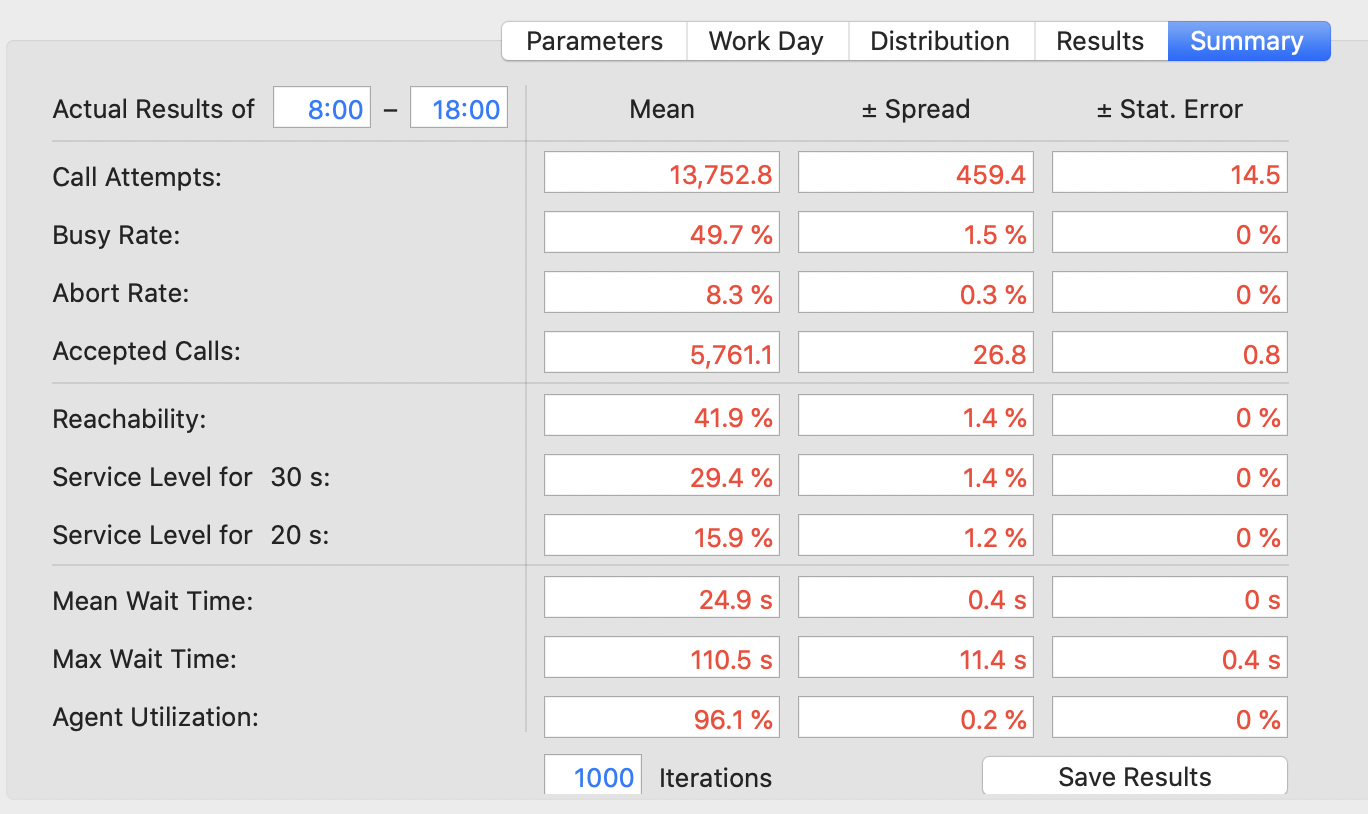
Let’s take 150 s (2.5 m) as the mean value of this distribution, a reasonable call duration in a call center. Here are the results of 1000 simulation runs for the whole workday (8 am to 6 pm) with these parameters:
OK, as I said it’s a quite bad situation for our call center. The mean reachability if only about 42% with a high busy rate of almost 50%. Each observed value (e.g. the reachability) has a spread as well as a statistical error. The spread reflects the variance of this result in the call center model. If we repeat the simulation the result of this run will lie with 68% probability within these bounds:
|
1 |
Mean – Spread … Mean + Spread |
The statistical error reflects the quality of our simulation. We do not know the true value and spread of our result parameters because we cannot repeat the simulation for an infinite number of times. The shown result values and spreads are only guesses of the true values and spreads depending on the number of simulation runs we have performed. The true values and spreads lie with 68% probability within these limits:
|
1 2 |
True Mean: Mean – StatisticalError … Mean + StatisticalError True Spread: Spread – StatisticalError … Spread + StatisticalError |
OK, for our call center we measured a reachability of 41.9%. But what happens if we choose a different distribution for the call duration but with the same mean value. CCsim allows us to take any custom made distribution for all random values. Well, let’s try a quite different distribution for the call duration.
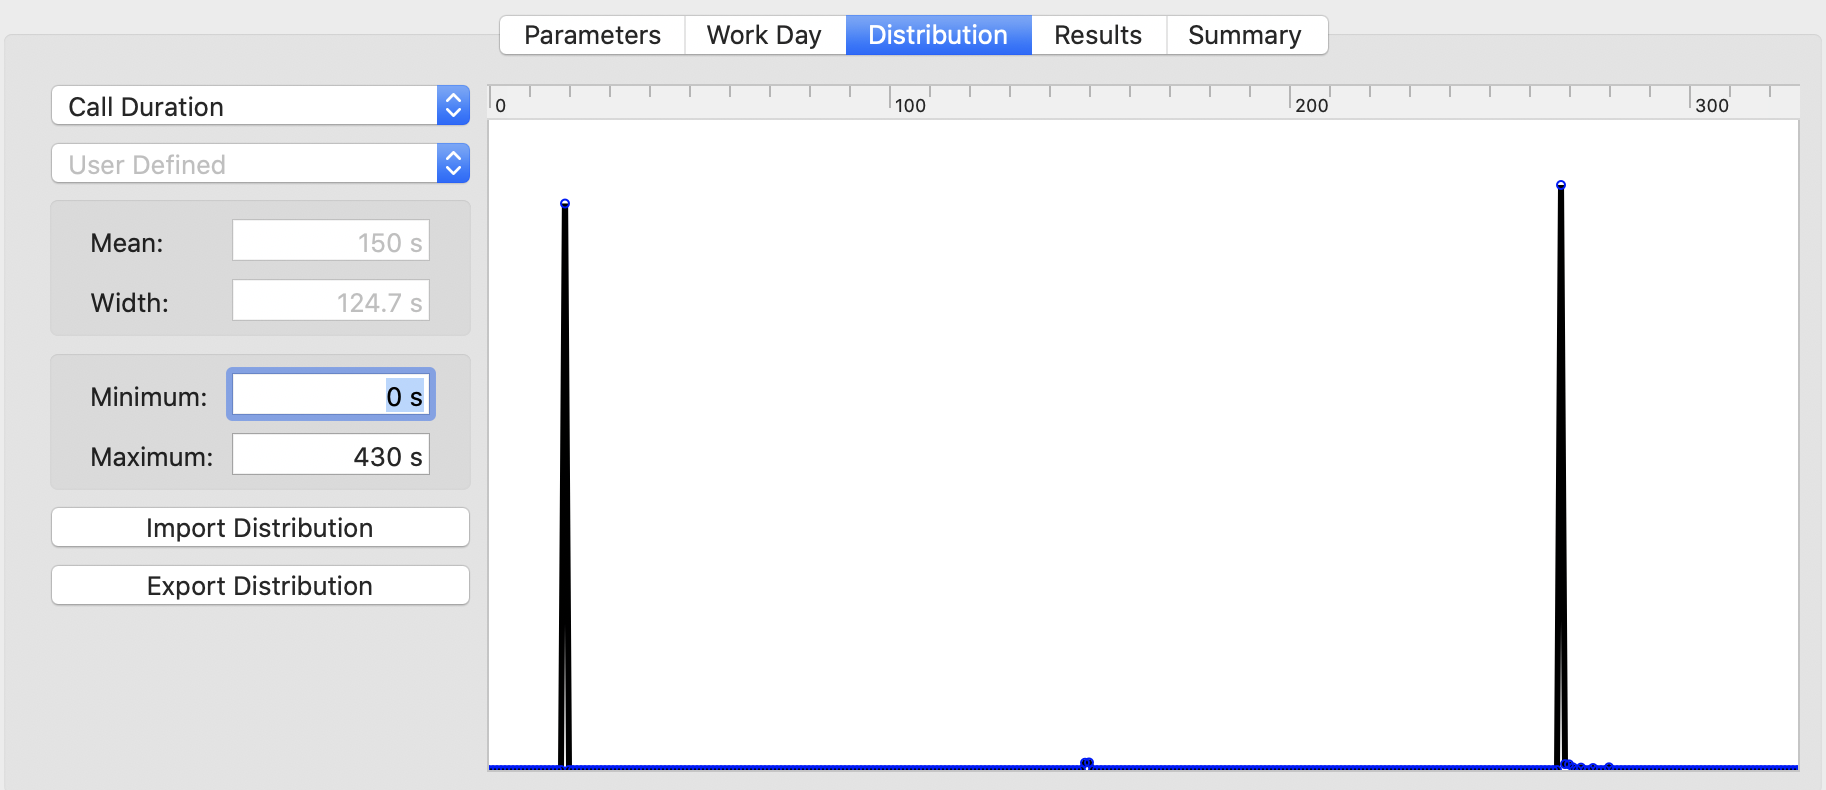
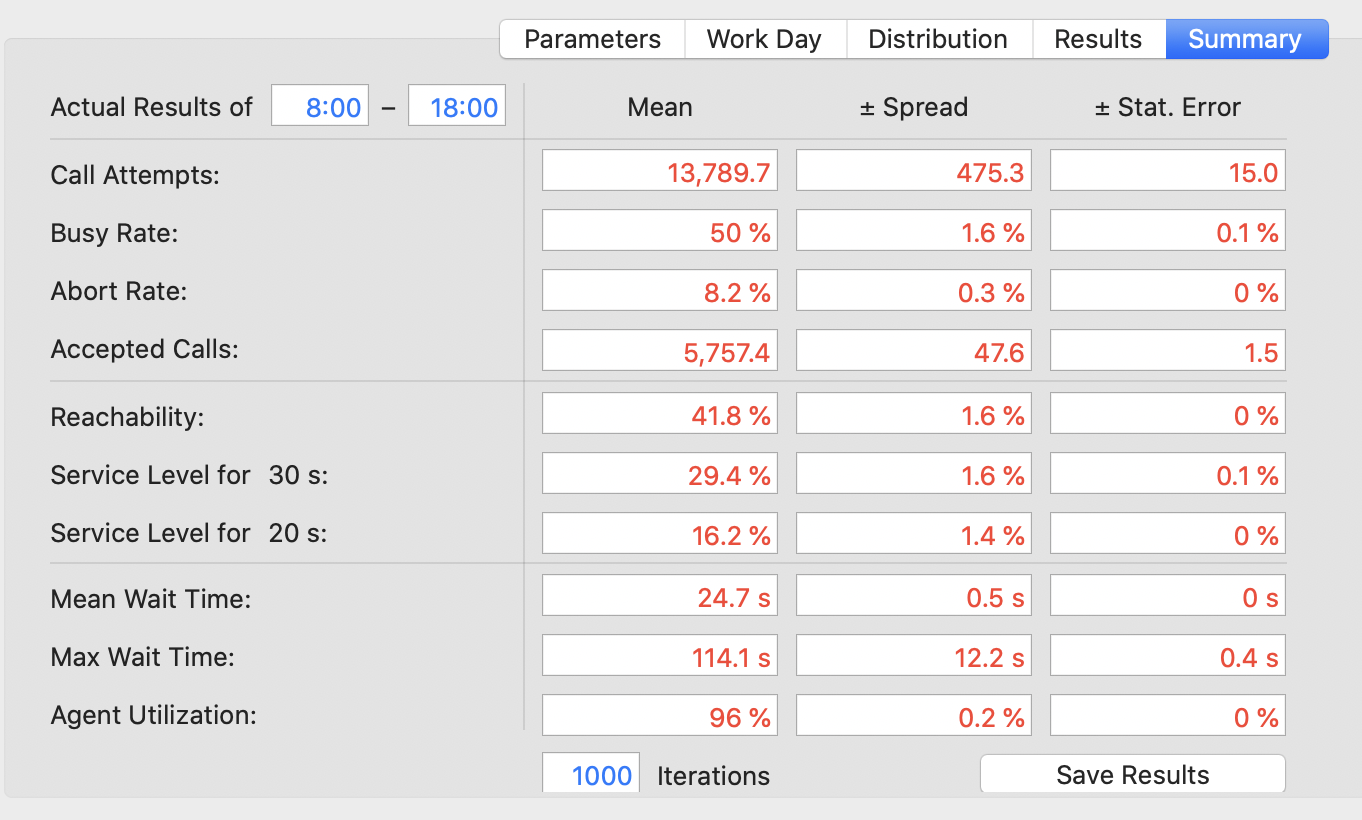
This hardly can be called a distribution; it only consists of two values, 20 s and 270 s with the mean of 150 s. Here are the results of 1000 simulation runs with that distribution.
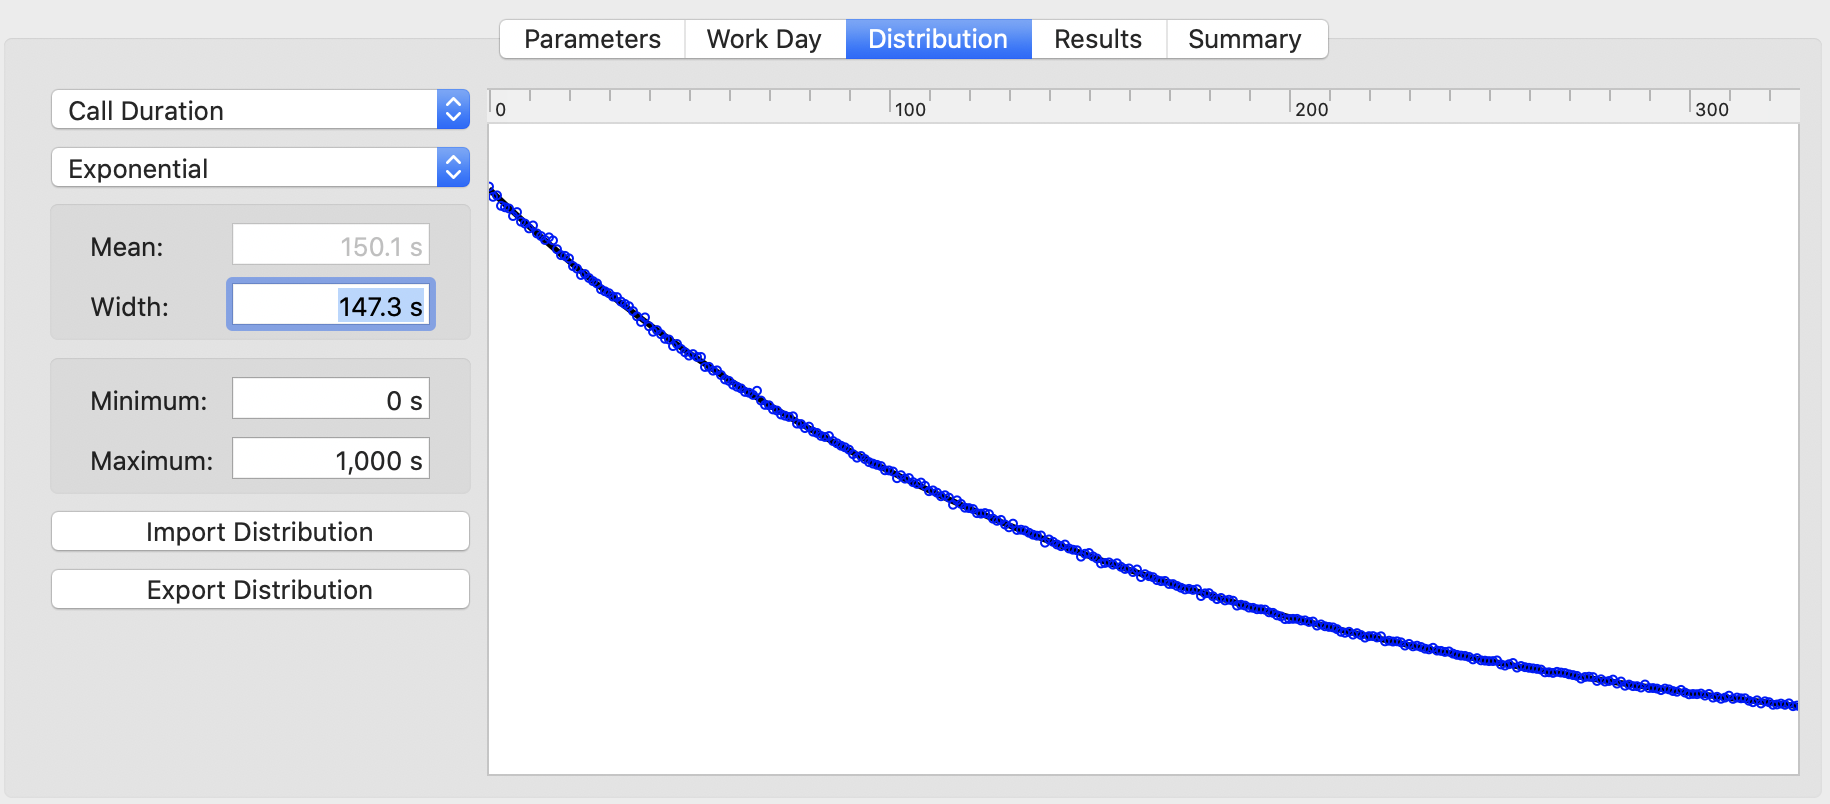
OK, the results are almost exactly the same as those of the Maxwell-Boltzmann distribution. Let’s try some more. This is another kind of extremely different distribution. It’s a falling exponential function for the call duration with the same mean value of 150 s.
Here are the results of the simulation runs:
Again, the mean result values are almost the same. Maybe the spread of the values is a little bit higher but that’s it.
So, the conclusion is a little bit disappointing for me. The actual shape of the distribution doesn’t really matter for the results; the mean values determine almost exclusively the results of the simulation.
